I am proud to announce the launch of a new book, centered around the importance of SQL, authored by six consultants from 3Cloud. Our new book is called “SQL Query Design Patterns and Best Practices.” This project was brought to us by PACKT and it’s a unique opportunity as we have five brand new authors on the project. Steve Hughes worked with the publisher to create a plan and recruit authors from within the talented data practice at 3Cloud.
The focus of this book is primarily to help those citizen developers who have limited experience in SQL to expand their knowledge to the next level. While the book can be read end to end, it is designed in multiple parts to support different subject areas that meet the needs of these new developers. In the first part of the book, we spend most of our time dealing with best practices on query design. We follow that up with the implementation of some difficult features that have a great use case in report writing and similar types of queries.
The second half of the book guides developers through using query tuning tools and techniques, including indexes. While our focus is not on creating the indexes, it is important to understand how the indexes can impact and improve your queries as you build your queries. We wrap up with some coverage on modern data estate solutions, including working with JSON, querying files, and creating Jupyter notebooks to manage and share SQL solutions.
About the Authors:
This is not the first book that Steve Hughes has worked on, but that is not true for the rest of the authors. Chi Zhang, Leslie Andrews, Dennis Neer, Shabbir Mala, and Ram Babu Singh worked on a few chapters each in this project, which gives them their first opportunity to coauthor a published book. “As lead on this project, I (Steve Hughes) must say I’m very proud that they tackled this project in such a short timeline. I hope this gives them the opportunity to author more books in the future as we look forward to seeing great things from them.”
I am truly excited to have helped 5 new authors get started!
We would like to thank PACKT for their support as we worked through this project. They did a marvelous job supporting this group of new authors on their first project! The project leaders and editors were patient and thoughtful throughout the entire project.
We are all grateful to be working for a company who supports our efforts to become the best consultants in the market and look forward to more opportunities to share our expertise.
If you’re interested in reading the book, please feel free to check us out on Amazon.
I have been living with ALS for the past two years. I was diagnosed in September 2022 but had my first symptoms and started researching what was going on in July 2021. As I begin to understand my diagnosis more, I realize that this is a progressive disease, and my needs and situation will change over time. In my situation, I lost the use of my arms and hands first and I’ve begun to lose functionality in my legs and torso over the past few months. To learn more about my journey to this point check out this video on YouTube which tells my personal story.
Launching the YouTube Channel
Now that we’ve mentioned YouTube, Data on Wheels is launching its YouTube channel focusing first on my ALS story. While this YouTube channel will support technical content like the Data on Wheels and the Data on Rails blogs, it will also support ALS awareness and accessibility technology.
I realized early on that a blog post was not the best way to share the story or tools that I use while working with ALS. We will have a couple of playlists that are directly related to this part of my story. We will have a playlist called Living with ALS that focuses on my personal journey and various things we’ve learned or experienced in the process. We will also have a playlist that’s called Working with ALS that will focus on the tools I use to keep me working and how I keep working as my disease progresses.
While I wish we could have started this much earlier, the disease itself has slowed my ability to complete some of these tasks as quickly as I wished. It is with a lot of help from my family who have supported me through video editing, content support, and motivation that we’ve been able to get this launched. I hope you enjoy it for what it is, and I look forward to having a number of you follow and learn more about accessibility.
Global Accessibility Awareness Day 2023
I had the opportunity to work with the Voice Access team from Microsoft on a story video that was used on Global Accessibility Awareness Day, May 19, 2023. I am truly impressed with the work Microsoft has done with Windows and Office to create more accessible experiences for those of us who need help doing our day-to-day job. When I think about how Voice Access has truly helped me be productive in my day-to-day work needs such as IMs in Teams, it was a pleasure to work with them to do a video to promote this tool. You can check out the video in the Voice Access area here. You can also learn more about the other accessibility options available in Windows 11.
Supporting the Cause -ALS Walk Lexington, August 2023
As part of the effort we’re doing around ALS Awareness this month, Data on Wheels is the team name for our team that will be doing the ALS Walk in Lexington KY this year. This is an opportunity for us to do our part to help the local community continue to do great things for the ALS community. Check out our team site and support if you can. Every little bit counts. If you’re in the area and want to join us for the short walk that happens in August feel free to sign up on the team.
3Cloud – Inclusive and Supportive Workplace
I was employed at 3Cloud when my disability first surfaced. As you can imagine, it was an emotional roller coaster and I really needed to determine how much it would affect my ability to do work for the company. As you have seen above or in one of my stories, this disease first affected my hands and arms and my ability to type. Without knowing the speed or rate of the disease and the impact to my current workload, I was able to work with my bosses to find a good place for me in the company which allowed me to contribute while I sorted this out. With their help, I have been able to find a place to continue to contribute and participate in the technology that I love to work with. For example, just this past week, Microsoft released a new product called Microsoft Fabric that I’ve been working with them and our team on to understand how to best work with it in our field. The company has trusted me with this and other initiatives that have allowed me to continue to be productive and generally contribute to the growth and success of 3Cloud.
Wrapping It Up
ALS has changed a lot about how I work and how I view life. I hope that what I share about what I learn helps others in similar situations. I will continue to be as active as I can both through work and in the community. Each day is a new day. Some days bring good things and some days bring bad, but God is in control of it all. Thank you for your continued support!
This blog is intended to be a follow up from the SQL Saturday 2022 in Oregon & SW Washington. In that session I presented an introduction to FHIR and JSON data produced from the Azure Health Services API’s.
With the recent updated mandates in the healthcare environment in the United States, Microsoft has continued to expand its capability to support the FHIR standard for integrating healthcare data. While the standard is well documented and Microsoft’s capabilities are expansive, it falls on data professionals to interpret that data and build meaningful reports and produce meaningful insights from the data as it is collected and integrated across environments. This requires a good working knowledge of JSON in SQL to manipulate complex data models. In the session, we did a short review of the FHIR standard and the overall implementation of FHIR in Azure. From there we reviewed the resulting data in the data lake and in Synapse. That was followed up with an overview into the heart of complex SQL using JSON functions in Synapse. Whether or not you are active in healthcare today, this will be an enlightening session on how to use JSON SQL functions within the Azure SQL platforms.
What is FHIR and why should you care?
FHIR stands for Fast Healthcare Interoperability Resources. this is the latest specification for interoperability in healthcare produced by HL7. To be clear the word fast has nothing to do with performance, but more about the ability to implement and integrate data quickly. With the latest regulations around the world in health care, this standard is the established standard for integrating healthcare data and we’ll continue to be on the forefront of this work. If you do any work in health care, you will need to understand FHIR because you will likely run across data formatted to the standard from many different sources.
FHIR is very well documented. In many ways when the standard is properly followed the JSON documents or other supported formats are effectively self-documenting. It is commonly understood that the core FHIR specification handles about 80% of the use cases in healthcare. It is designed to be flexible so that it can support specialized needs within regions or healthcare areas. For example, in the US there is a need to support race and ethnicity. The U.S. Core Implementation Guide provides guidance on the specification enhancements to support this need for U.S. healthcare organizations. You will find similar support for other countries as well as specific implementations for healthcare vendors such as Epic.
Neither the notebook, the presentation, or this blog is expected to be and exhaustive coverage of FHIR. before we move on to some of the other implementation pieces, it is important to understand one key aspect of FHIR is the basic building block called a resource. A resource is the core exchangeable content within the specification. All resources share the following characteristics:
A common way to define and represent the resource including data types and patterns
A common set of metadata which can be discovered easily
A human readable part
For more detailed information on the supported resources and other details around FHIR implementation, you should visit the following website:
Azure Health Services and the FHIR API
I will not be digging into a lot of the health care services information nor the FHIR support within Azure in this post. The important things to understand is that Microsoft has made a concerted effort to support this specification which includes technology and architectures for the extraction of data from various healthcare systems which will then use the FHIR APIs to standardize that extracted data into the FHIR spec typically in JSON files in the data lake. Because of the standardized format, Microsoft is able to supply a set of common schemas that can be used in serverless synapse to create external tables and views to accelerate the implementation and usage of data produced from the APIs. It is from this starting point that we are able to start working with the data in reporting and analytics solutions.
At this point I want to put a plug in for the company I work for. If you're interested in learning how Azure health services and the FHIR specification can be implemented at your company, we have FHIR Quick Start and FHIR Data Blueprint solutions. These solutions have been used by many other customers to achieve high levels of integration in their health care data estate. If you're interested in learning more, please reach out to us at: https://3cloudsolutions.com/get-started/
Working with the data from the FHIR API using JSON in SQL
As noted in the previous section, Azure Health Services comes with setup serverless tables and views to be used with the extracted data. However due to the complexity of FHIR, there are a number of columns within those tables and views which still contain JSON snippets. For example, there is one field for name which has several objects and arrays to support the specification. You cannot simply select the name from the table and use that as you move forward. There are many different fields like this throughout the data. For the rest of this blog and in the notebook, we will work through a number of scenarios to build a view of the patient resource that can be used for simple reporting. This view will contain a few JSON functions from SQL Server and solve simple to complex scenarios in the illustration.
The functions we will be using:
ISJSON
JSON_VALUE
OPENJSON
In addition to these functions, we will also be using the CROSS APPLY operator in SQL to join our data with relational data.
The examples in the notebook are built on the tables resulting from working with the Azure FHIR API. I am unable to provide a sample of the data to use with the set of information in the notebook currently. However, the SQL will work if you have your own FHIR implementation and a Patient resource to work with. rather than rewrite the entire contents of the notebook in the blog post, here is a link to the notebook.
If you plan to implement this in the same way, you will need Azure Data Lake, Azure Synapse serverless, and Azure Data Studio. the notebook can be opened in Azure Data Studio. If you are unfamiliar with working with notebooks inside of Azure Data Studio, you are not alone. Check out this post which discusses how to implement your first notebook in Azure Data Studio.
Building our view and SQL with JSON functions
If you decide not to open the notebook but are curious what the view looks like here is a finished product that we created in the notebook.
SELECT TOP (20) p.resourceType + '/' +  p.id as PatientResourceID
    , p.resourceType as ResourceType
    , p.id as ResourceID
    , cast(p.[meta.versionId] as int) as VersionID
    , cast(p.[meta.lastUpdated] as DATETIME2(7)) as LastUpdated
    , JSON_VALUE(p.[name], '$[0].family') as LastName
    , JSON_VALUE(p.[name], '$[0].given[0]') as FirstName
    , cast(p.active as bit) as IsActive
    , p.gender as Gender
    , CAST(p.birthDate as date) as BirthDate
    , CASE WHEN p.[maritalStatus.coding] is null THEN NULL
           WHEN  JSON_VALUE(p.[maritalStatus.coding], '$[0].system') = 'http://terminology.hl7.org/CodeSystem/v3-MaritalStatus'
                    THEN JSON_VALUE(p.[maritalStatus.coding], '$[0].code')
           ELSE NULL
           END as MaritalStatus
    , CASE WHEN JSON_VALUE(p.[address], '$[0].use') = 'home' THEN JSON_VALUE(p.[address], '$[0].state')
            WHEN JSON_VALUE(p.[address], '$[1].use') = 'home' THEN JSON_VALUE(p.[address], '$[1].state')
            WHEN JSON_VALUE(p.[address], '$[2].use') = 'home' THEN JSON_VALUE(p.[address], '$[2].state')
            WHEN JSON_VALUE(p.[address], '$[3].use') = 'home' THEN JSON_VALUE(p.[address], '$[3].state')
            ELSE NULL
            END as HomeStateOrProvince
    , e.Ethnicity
    , r.Race
FROM fhir.Patient p
INNER JOIN (SELECT id, max([meta.versionId]) as currentVersion FROM fhir.Patient GROUP BY id) cp
    ON p.[meta.versionId] = cp.currentVersion
    AND p.id = cp.id
LEFT JOIN
    (SELECT p.id
        , CASE WHEN JSON_VALUE(ext.value,'$.extension[0].url') = 'ombCategory'
            THEN
            CASE WHEN JSON_VALUE(ext.value, '$.extension[1].valueString') IS NOT NULL  THEN JSON_VALUE(ext.value, '$.extension[1].valueString')
                    WHEN JSON_VALUE(ext.value, '$.extension[0].valueString') IS NOT    NULL THEN JSON_VALUE(ext.value, '$.extension[0].valueString')
                    ELSE JSON_VALUE(ext.value, '$.extension[0].valueCoding.display')
                    END
            ELSE JSON_VALUE(ext.value, '$.valueCodeableConcept.coding[0].display')
            END AS Ethnicity
        FROM
        (
            SELECT fp.id, fp.extension FROM fhir.Patient fp
            INNER JOIN (SELECT id, max([meta.versionId]) as currentVersion FROM fhir.Patient GROUP BY id) cp
                ON fp.[meta.versionId] = cp.currentVersion
                AND fp.id = cp.id
            WHERE ISJSON(fp.extension) =1
        ) p
        CROSS APPLY
            OPENJSON(p.extension,'$'
            ) as ext
        WHERE JSON_VALUE(ext.value,'$.url') = 'http://hl7.org/fhir/us/core/StructureDefinition/us-core-ethnicity'
    ) e on e.id = p.id
LEFT JOIN
    (SELECT p.id
        , CASE WHEN JSON_VALUE(ext.value,'$.extension[0].url') = 'ombCategory'
            THEN
            CASE WHEN JSON_VALUE(ext.value, '$.extension[3].valueString') IS NOT NULL THEN JSON_VALUE(ext.value, '$.extension[3].valueString')
                    WHEN JSON_VALUE(ext.value, '$.extension[2].valueString') IS NOT NULL THEN JSON_VALUE(ext.value, '$.extension[2].valueString')
                    WHEN JSON_VALUE(ext.value, '$.extension[1].valueString') IS NOT NULL THEN JSON_VALUE(ext.value, '$.extension[1].valueString')
                    WHEN JSON_VALUE(ext.value, '$.extension[0].valueString') IS NOT NULL THEN JSON_VALUE(ext.value, '$.extension[0].valueString')
                    ELSE JSON_VALUE(ext.value, '$.extension[0].valueCoding.display')
                    END
            ELSE JSON_VALUE(ext.value, '$.valueCodeableConcept.coding[0].display')
            END AS Race
        FROM
        (
            SELECT fp.id, fp.extension FROM fhir.Patient fp
            INNER JOIN (SELECT id, max([meta.versionId]) as currentVersion FROM fhir.Patient GROUP BY id) cp
                ON fp.[meta.versionId] = cp.currentVersion
                AND fp.id = cp.id
            WHERE ISJSON(fp.extension) =1
        ) p
        CROSS APPLY
            OPENJSON(p.extension,'$'
            ) as ext
        WHERE JSON_VALUE(ext.value,'$.url') = 'http://hl7.org/fhir/us/core/StructureDefinition/us-core-race'
    ) as r on r.id = p.id
Here is a sample of the results from that view:
PatientResourceID
ResourceType
ResourceID
VersionID
LastUpdated
LastName
FirstName
IsActive
Gender
BirthDate
MaritalStatus
HomeStateOrProvince
Ethnicity
Race
Patient/d8af7bfa-5008-4a0f-85d1-0af3448a31dd
Patient
d8af7bfa-5008-4a0f-85d1-0af3448a31dd
2
2022-05-31 18:07:03.2150000
DUCK
DONALD
1
male
1965-07-14
NULL
ON
NULL
NULL
Patient/78cf7725-a0e1-44a4-94d4-055482781afb
Patient
78cf7725-a0e1-44a4-94d4-055482781afb
1
2022-05-31 18:07:30.7490000
Gretzky
Wayne
NULL
NULL
1990-05-31
NULL
NULL
NULL
NULL
Patient/9e909e52-61a1-be50-1878-a12ef8c36346
Patient
9e909e52-61a1-be50-1878-a12ef8c36346
4
2022-05-31 18:39:58.1780000
EVERYMAN
ADAM
NULL
male
1988-08-18
M
NULL
Non Hispanic or Latino
White+Asian
Patient/585f3cc0-c727-4989-9214-a7a7b60a2ade
Patient
585f3cc0-c727-4989-9214-a7a7b60a2ade
1
2022-05-31 13:14:57.0640000
DUCK
DONALD
1
male
1965-07-15
NULL
ON
NULL
NULL
Patient/29a819c4-f553-8189-2354-9441b86d37ef
Patient
29a819c4-f553-8189-2354-9441b86d37ef
1
2022-05-18 15:18:40.1560000
FORD
ELAINE
NULL
female
1992-03-10
NULL
NULL
NULL
NULL
Patient/d5fe6802-a680-e762-8f43-9659340b00ac
Patient
d5fe6802-a680-e762-8f43-9659340b00ac
3
2022-05-18 14:39:52.2550000
EVERYMAN
ADAM
NULL
male
1961-06-15
S
NULL
NULL
C
Patient/4d661053-a8d0-148c-7023-54508fd04a52
Patient
4d661053-a8d0-148c-7023-54508fd04a52
1
2022-05-21 13:48:24.9720000
EVERYMAN
sam
NULL
male
1966-05-07
M
NULL
Not Hispanic or Latino
White
Wrapping it up
As you can see, understanding the specification well enough to build a complex SQL statement using JSON functions is required to work within FHIR effectively. Due to the complex nature of the nested JSON, you may not be able to reconcile this in tools such as power BI. Being able to build this out in SQL guarantees that you have provided you will report writers and analysts with a solid result set which can be used with confidence.
If you are an avid report designer or user, you may have wanted to see the percent difference between one row and the previous one. Sounds easy right? Well let’s break it down. Percent difference follows a consistent formula: (current value – previous value)/previous value. Current value? Easy peasy. Previous value? That’s where this blog comes into play. It’s fairly simple to get the previous month value or previous date period value because Power BI can tell it exactly what the filter would be (September minus one month is always August ). However, there may not have been any invoices in August, so how can we compare September with the last month that had an invoice?
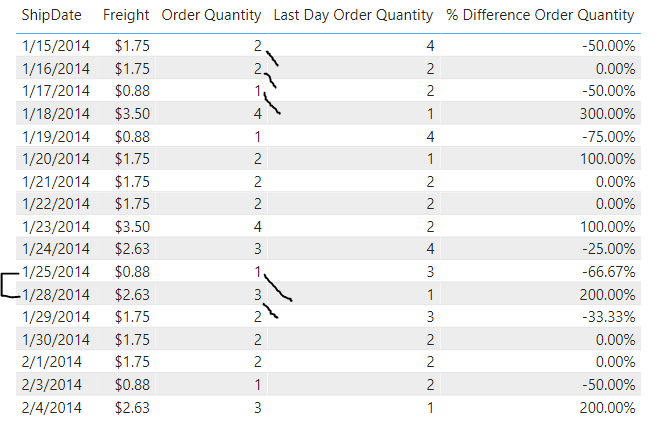
Let’s set the scene for this example. A business user has requested to compare each day’s orders with the previous day they had orders. To get the previous day that had orders, we can create a measure called Last Day Order Quantity (see below). Within this measure, you’ll notice we use a variable to calculate the measure Order Quantity. By pulling this into the variable, it will save the row context for Order Quantity so we can make sure that we are only looking at rows that have orders. The next variable (LastDayOrdered) filters the ship date table to grab the last date where 1. there are orders (Order Quantity is not blank) and 2. the current day (aka the row we are currently on) also has orders. The final variable does the work of calculating our order quantity for the last day that contained orders.
Last Day Order Quantity =
VAR Orders = [Order Quantity] //grab the charge amount for this line
VAR LastDayOrdered = MINX(FILTER(ALL('ShipDate'),'ShipDate'[DaysAgo]>MAX('ShipDate'[DaysAgo]) &&[Order Quantity] <> BLANK() && Orders<>BLANK()),'ShipDate'[DaysAgo])
VAR LastDayOrders = CALCULATE([Order Quantity],FILTER(ALL('ShipDate'),'ShipDate'[DaysAgo]=LastDayOrdered))
RETURN
LastDayOrders
As you can see in the screenshot above, there is a gap in ship dates between 1/25/2014 and 1/28/2014 and the last day order quantity pulls in the amount from 1/25/2014 (1) instead of grabbing it from 1/27/2014 (0). Sweet! Now that makes finding the % difference in order quantity very simple. Below is the full code from this example and also a more parameterized version with tons of comments to help you use it as needed. Happy coding!
Final Measure:
% Difference Order Quantity =
VAR Orders = [Order Quantity] //grab the charge amount for this line
VAR LastDayOrdered = MINX(FILTER(ALL('ShipDate'),'ShipDate'[DaysAgo]>MAX('ShipDate'[DaysAgo]) &&[Order Quantity] <> BLANK() && Orders<>BLANK()),'ShipDate'[DaysAgo])
VAR LastDayOrders = CALCULATE([Order Quantity],FILTER(ALL('ShipDate'),'ShipDate'[DaysAgo]=LastDayOrdered))
RETURN
DIVIDE(Orders-LastDayOrders,LastDayOrders,0)
Commented version:
% Difference =
//Make a variable to grab the value of your measure at your current line (we will use this later)
VAR Desired_Measure = [Order Quantity]

//Now we need to grab the time where this desired measure was not null
//In my example, ship date is the column that I want to see the previous order quantity sliced by
VAR Last_Time_Measure_Had_Value =
    // I use MINX here to ensure I get the previous day, not the next day. Feel free to flip this as desired.
    MINX(FILTER(ALL('ShipDate')
        //this makes sure that I'm only grabbing ship dates that are before my current ship date.
        ,'ShipDate'[DaysAgo] > MAX('ShipDate'[DaysAgo])
        //this makes sure that the options for days ago only include ones that we had orders on, AKA the desired measure is not NULL for this day.
        //DO NOT USE Desired_Measure here because desired_measure will only look at your current row and we are trying to look at all the rows to make sure we are grabbing a non-NULL one.
        &&[Order Quantity] <> BLANK()
        //this checks that the current row is not blank.
        && Desired_Measure<>BLANK())
    //I need this variable to return the smallest number of days ago (hence the MINX at the beginning) that meets the criteria above
    //For your use, you should swap daysago with whatever field you are hoping to slice and dice by
    ,'ShipDate'[DaysAgo])

//This final variable calulcates my desired measure (order quantity) and filters my table for the last time that measure had a value.
VAR Last_Instance_Of_Calculated_Measure = CALCULATE([Order Quantity],FILTER(ALL('ShipDate'),'ShipDate'[DaysAgo]=Last_Time_Measure_Had_Value))

//Easy peasy now! We can take our current days orders - last day we had orders number of orders, divded by the last day we had orders number of orders to get the % growth day over day. Phewf!
RETURN
DIVIDE(Desired_Measure - Last_Instance_Of_Calculated_Measure,Last_Instance_Of_Calculated_Measure,0)
While not the first time I have authored, this is the first book that I wrote as the sole author. Analysis Services is the product I built my career in business intelligence on and was happy to take on the project when I was approached by Packt.
I think one of my favorite questions is about how much research time did I put in for this book. The right answer is almost 20 years. I started working with Analysis Services when it was called OLAP Services and that was a long time ago. Until Power Pivot for Excel and tabular model technology was added to the mix, I worked in the multidimensional model. I was one of the few, or so it seems, that enjoyed working in the multidimensional database world including working with MDX (multidimensional expressions). However, I was very aware that tabular models with the Vertipaq engine were the model of the future. Analysis Services has continued to be a significant part of the BI landscape and this book give you the opportunity to try it out for yourself.
This book is designed for those who are most recently involved in business intelligence work but have been working more in the self-service or end user tools. Now you are ready to take your model to the next level and that is where Analysis Services comes into play. As part of Packt’s Hands On series, I focused on getting going with Analysis Services from install to reporting. Microsoft has developer editions of the software which allow you to do a complete walk through of everything in the book in a step by step fashion. You will start the process by getting the tools installed, downloading sample data, and building out a multidimensional model. Once you have that model built out, then we do build a similar model using tabular model technology. We follow that up by building reports and visualizations in both Excel and Power BI. No journey is complete without working through security and administration basics. If you want learn by doing, this is the book for you.
If you are interested in getting the book, you can order it from Amazon or Packt. From November 20, 2020 through December 20, 2020, you can get a 25% discount using the this code – 25STEVEN or by using this link directly.
I want to thank the technical editors that worked with me to make sure the content and the steps worked as expected – Alan Faulkner, Dan English, and Manikandan Kurup. Their attention to detail raised the quality of the book significantly and was greatly appreciated.
I have to also thank Tazeen Shaikh who was a great content editor to work with. When she joined the project, my confidence in the quality of the final product increased as well. She helped me sort out some of the formatting nuances and coordinated the needed changes to the book. Her work on the book with me was greatly appreciated. Finally, many thanks to Kirti Pisat who kept me on track in spite of COVID impacts throughout the writing of the book this year.