Reports are only as useful as they are easily understandable. When making reports for executives and other business leaders, it is vital to ensure the context and insights of the report are easy to understand at a glance. As cultivators of data, we have a responsibility to make sure it is used and interpreted correctly otherwise data can quickly be used to come to incorrect conclusions. When users don’t understand data, they often distrust any data-driven decisions and go back to using instinct to make important business decisions.
While it’s important to give context to reports, the method of doing so may seem cumbersome. Some options include explaining the report to every new user or taking up valuable report space with explanations and contexts. For end user experience, it’s often best to replicate something they are already familiar with like a webpage. Many websites contain options for giving additional details to curious end users, typically they signal these resources with an “i” or information icon. We can replicate that functionality in Power BI by using UNICHAR characters and a hidden page.
The steps below will walk through how to add an information icon to the report, making a tooltip page containing your additional information, and enabling the tooltip to allow users to hover over the icon and see the information.
1. Make the following measure in your measures table: Info Button = UNICHAR(128712)
2. Create a card visual and add this measure to it. You’ll see the following icon:
3. Create an additional page with a text box containing your additional information.
4. Hide this information page and configure it to be used as a tooltip. You may also want to resize it so that when users view it as a tooltip on the info icon it will cover the entire report. To hide the page, right click on the page name and select “Hide Page”. To get to the page configurations, you’ll need to select a blank section of the page (this avoids any visual configuration settings) and select the format paint brush. For resizing, I recommend setting it as a custom type then adjusting your pixels until it nearly fits your text box. Note: it will automatically align top left, so it’s best to align your text box to top left so as you resize you don’t lose your text box.
5. Add this info page as a tooltip for the card visual containing the info button. To do this, you’ll need to select your card visual, go to the format pane, and turn tooltips on. Once tooltips are on, you can select the type of report page then select the page that you made earlier with your additional information.
Now when you hover over the icon, the tooltip will display your additional information. In the example below, I’ll mess with the pixels more on the info page until it’s the appropriate size for the amount of information I want to convey.
And that’s all there is to it! One valid alternative to this is to make a bookmark that would lead end users to the information page. Personally, I prefer this tooltip method so end users do not lose their place within the report and it is small enough to be put on every page of the report.
When deciding if Power BI is the correct reporting platform to meet your business’s needs, price is a large factor. Power BI pricing models are based around SKU’s and v-cores, but how do you know how many you will need? Unfortunately, the ratio of capacity to expected usage is not easily determined.
For example, one instance may have a very large data model that takes a lot of memory and CPU time to refresh, 20 users at peak viewing times, hourly refreshes, and the queries are all very simple and allow for query folding. Another business may have six smaller data models, 950 users at peak viewing times, daily refreshes, and the queries populating the data model are all very very complex. All of these elements impact the usage at any given time, making predicting overall CPU needs nearly impossible. Thankfully, stress testing your capacity gives us an option that is not purely reactionary.
This blog will walk through how to stress test your capacity, the elements of capacity planning, and how to understand the results of the stress test.
Navigate to the GitHub for the Load Test Tool and download the zip file containing the PowerShell script. There are two options of load testing tools, the default tests the “worst case scenario” where all of your users log on at the same time and continually mess around with filters so Power BI is forced to ignore it’s cache. The Realistic Load Test Tool operates similar to the default load test tool, but instead of testing the initial load time, it tests programmable functionality that end users would likely do such as changing slicers, filters, and navigating through bookmarks with some “think time” between operations. For this demo, we’ll walk through the standard load test tool to keep it simple. Please refer to the ReadMe file for further instructions on using the realistic load test tool.
NOTE: This PowerShell script contains an unsigned PowerShell script. You must first use Set-ExecutionPolicy Unrestricted command in order to allow running of unsigned scripts. It also requires the “MicrosoftPowerBIMgmt” Power BI PowerShell modules to be installed from here.
2. Unzip the file into a folder on your desktop (or within a VM) and navigate to the Initiate_Load.ps1 file. Right click on the file to run in PowerShell.
3. The PowerShell script will walk you through a number of prompts:
How many reports do you want to configure?
This will determine how many reports are pinged concurrently. Keep in mind, you can ping reports from different workspaces in the same PowerShell run. Type a number then hit enter.
Authentication
A pop-up will appear, use the login with access to the workspaces you wish to test.
Select workspace index from above
Type the number next to the workspace where the report you wish to stress test resides then hit enter.
Select report index from above
Type the number next to the report you wish to stress test then hit enter.
Filters require FilterTable, FilterColumn, MinimumValue, MaximumValue in FilterColumn
This will be how the script circumvents the caching feature in Power BI service. By providing a table, column, min, and max values, the script is able to pass different filter contexts to the loading reports. I recommend using a date table or fact table that interacts with the entire data model and use a numerical field (minimum and maximum do not make sense for text fields).
Make sure there are no spaces between the variables and the commas.
Example: I have a table called “Invoice Date”, a column called “MonthsAgo” that I would like to filter on. I would type “Invoice Date,MonthsAgo,0,4”
Enter number of instances to initiate for this report
This is the number of browser windows that will open and ping the report(s) you have designated. Type in a number then hit enter. I recommend starting with 10 then moving up to make sure you won’t crash your machine with browser windows.
Do you want to launch configured reports?[y/n]
If you are satisfied with the parameters set for the script, type “y” then enter. If you wish to abort the test run, type “n” then enter.
4. To test how refreshes may impact the user experience (and vice versa), go into the Power BI online service and manually refresh the Power BI datasets that power the reports you are stress testing. While the Load Testing Tool is great for testing interactive operations, testing background operations will need to be done outside this tool. There are REST API’s that can trigger Power BI datasets (Refresh PBI Dataset REST API), but we won’t cover that in this blog post.
5. If the number of browser windows exceeds your computer’s capabilities, the windows will time out and you will need to refresh the browser pages individually to get them to run again. I recommend only allowing 10 pages to be active at a time. You may notice there is a little counter in the upper left hand corner of the windows. This tells you how many times that window has pinged the Power BI service. To stop each window from pinging, you will need to close each window individually. All the windows will time out an hour after the initial script is run, since the token the API generates expires after one hour.
Tests are now completed! You will need to wait roughly 45 minutes before manually refreshing the dataset attached to the Capacity & Metrics report.
Considerations for Power BI Capacity Planning
Power BI capacity planning and management is no small task. Microsoft recommends setting your capacity size based on the size of your Power BI items (datasets, dataflows, etc.) because this will directly impact the speed of operations within a SKU (planning capacity in advance). This is a good rule of thumb, but unfortunately this method does not account for extremely high levels of interaction against a small number of items.
For example, let’s say you have one certified dataset and eight reports that use that dataset. There are 20-30 people viewing each report because it’s month end and all the analysts, account managers, and executives are prepping their presentations with screenshots from these reports. The strain on this dataset (and your capacity) will be as if there were 160-240 users interacting with the dataset. Now scale this up – imagine there are 100 people looking at each report. The usage against this dataset/item quickly grows, so your (hopefully) optimized certified dataset impacts the CPU much more than a dataset with only one report on it. That is why we must consider both background and interactive operations when estimating optimal SKU/CPU.
Capacity in Power BI is determined by a few variables:
Schema and size of data models used (background & interactive operation)
The number and complexity of required queries (background operation)
The hourly distribution of the usage of your application (interactive operation)
Data refresh rates and duration (background operation)
Thankfully, the Gen2 metrics app provides insight into the current state of the capacity based on each of these variables.
Reading the Results
The Premium Capacity Utilization And Metrics report measures your capacity usage for the previous 14 or 28 days depending on the visual. This report, much like capacity metrics themselves, can be complex and hard to understand. Microsoft has provided some documentation on the contents of this report, but let’s turn our focus to elements relating to the results Load Testing Tool stress testing we did above.
To start out, make sure you have refreshed the dataset powering the Capacity Metrics report (wait until 45 minutes have passed since running the tests to ensure the test results will be in the report).
Once you enter the report, to narrow the report down to the latest tests, pop open the filter pane and adjust the “Filters on all pages” Date filter to the date of the tests.
If you did multiple rounds of testing, it will be important to know what time you ran each test. The chart in the upper right hand side of the overview page is extremely useful for identifying if any of your tests resulted in a spike of CPU above the CPU limit. For example, I did 3 tests but only one resulted in a spike of 168% CPU. To learn more about this spike, we can right click on the spiked bar and drill through to the time point detail.
This is by far my favorite portion of the report. In this drill through, you are able to see the number of interactive operations that occurred within this 30 second interval on top of all the background operations in the past 24 hours. Let’s walk through what it all means.
The limitations of your current SKU are important to know when estimating the available workload. In our example, the SKU assigned is A1 which allows for 30 seconds of capacity CPU. Keeping that in mind, let’s see how many seconds of CPU our 611 operations resulted in.
50.6 seconds, resulting in 169.98% of the capacity. Wow! Because we used the Load Testing Tool, the user for all these interactions will be the Power BI User. However, in production environment, you should be able to tell if there is a specific user crazily clicking and filtering the report within a 30 second window. Thankfully, the user was able to successfully load the report with each filter and experienced no failures from the service, but we should likely scale our capacity if this behavior is expected consistently.
In our use case, the background interactions (refreshing data model) only accounted for .53% of the capacity over the past 24 hours. It’s important to keep in mind that while the total CPU seconds is much larger than the interactive operations, the background operations are calculated over a 24 hour time frame.
If you tested multiple datasets at a time, I recommend sorting by the artifact then holding down shift and cross sorting by the CPU(s) field. That way, you can tell if one dataset is consuming more resources than another (look at the average CPU seconds to determine that).
Using the three dots in the upper right hand corner of the visual, you can export these results into an excel or CSV to examine further or to stack results from multiple tests and compare.
For the example above, I would recommend increasing SKU’s for more CPU to accommodate the large number of interactive users that are expected. I would also recommend looking closely at the data models tested and ensuring query folding is occurring and a good star schema is in place.
Pragmatic Works is hosting a 2-day Power Platform online conference. If you are unable to get out to onsite conference but need some help with Microsoft Flow, PowerApps, or Power BI, this is a great opportunity to learn from some experts from around the world.Information About the Conference
This is a 2-day virtual conference covering Power BI, PowerApps and Flow. The cost is $49 for all sessions, recordings and bonus materials. There will be 12 sessions each day.
The following has been reposted with permission from Steve Howard a.k.a. @AngryAnalytics. I have made some formatting changes but the content is unchanged. Thanks again to Steve for allowing me to repost this content. You can find the original post and the rest of Steve’s great work on his blog.
Power BI Audit Log Analytics Solution
As Power BI adoption in your organization grows, it becomes more and more important to be able to track the activity in the environment.
When you start to think about deploying a Power BI Audit Log solution that is repeatable there are a few challenges that you will face.
Going to the O365 Audit Logs portal each time you want to extract log events is a manual process and doesn’t scale
When automating this process through API or PowerShell, there is a limit to how much data you can pull, therefore examples that are currently available also don’t scale very well
The AuditData field is a JSON format by default and although Power BI can parse JSON beautifully, when doing this over several thousand record entries may result in data load errors
Based on these factors, i have put together a PowerShell script that can be scheduled on a nightly basis that can iterate MORE than 5000 records so that no data is lost. Also, the screenshot below is of an initial template that you can use to start with to analyze your audit logs for your organization.
Update the PowerShell script with a UserID and Password that has O365 audit log privileges
Use Task Scheduler to schedule the PowerShell script to run each night at midnight (run as admin).
At the end of the script, specify the directory you would like the script to generate CSV files in
In the PBIX file, it was challenging to get a parameter to work for the file location that the CSVs are in, so in the Query Editor the script for the AuditLog table needs to be manually modified to include your file path.
Enjoy
Quick look at the PowerShell
First, there is a PowerShell script.
Set-ExecutionPolicy RemoteSigned

#This is better for scheduled jobs
$User = "<<enter o365 admin user email here>>"
$PWord = ConvertTo-SecureString -String "<<enter password here>>" -AsPlainText -Force
$UserCredential = New-Object -TypeName "System.Management.Automation.PSCredential" -ArgumentList $User, $PWord

#This will prompt the user for credential
#$UserCredential = Get-Credential

$Session = New-PSSession -ConfigurationName Microsoft.Exchange -ConnectionUri https://outlook.office365.com/powershell-liveid/ -Credential $UserCredential -Authentication Basic -AllowRedirection
Import-PSSession $Session

$startDate=(get-date).AddDays(-1)
$endDate=(get-date)
$scriptStart=(get-date)

$sessionName = (get-date -Format 'u')+'pbiauditlog'
# Reset user audit accumulator
$aggregateResults = @()
$i = 0 # Loop counter
Do {
 $currentResults = Search-UnifiedAuditLog -StartDate $startDate -EndDate $enddate `
 -SessionId $sessionName -SessionCommand ReturnLargeSet -ResultSize 1000 -RecordType PowerBI
 if ($currentResults.Count -gt 0) {
 Write-Host (" Finished {3} search #{1}, {2} records: {0} min" -f [math]::Round((New-TimeSpan -Start $scriptStart).TotalMinutes,4), $i, $currentResults.Count, $user.UserPrincipalName )
 # Accumulate the data
 $aggregateResults += $currentResults
 # No need to do another query if the # recs returned <1k - should save around 5-10 sec per user
 if ($currentResults.Count -lt 1000) {
 $currentResults = @()
 } else {
 $i++
 }
 }
} Until ($currentResults.Count -eq 0) # --- End of Session Search Loop --- #

$data=@()
foreach ($auditlogitem in $aggregateResults) {
 $datum = New-Object –TypeName PSObject
 $d=convertfrom-json $auditlogitem.AuditData
 $datum | Add-Member –MemberType NoteProperty –Name Id –Value $d.Id
 $datum | Add-Member –MemberType NoteProperty –Name CreationTime –Value $auditlogitem.CreationDate
 $datum | Add-Member –MemberType NoteProperty –Name CreationTimeUTC –Value $d.CreationTime
 $datum | Add-Member –MemberType NoteProperty –Name RecordType –Value $d.RecordType
 $datum | Add-Member –MemberType NoteProperty –Name Operation –Value $d.Operation
 $datum | Add-Member –MemberType NoteProperty –Name OrganizationId –Value $d.OrganizationId
 $datum | Add-Member –MemberType NoteProperty –Name UserType –Value $d.UserType
 $datum | Add-Member –MemberType NoteProperty –Name UserKey –Value $d.UserKey
 $datum | Add-Member –MemberType NoteProperty –Name Workload –Value $d.Workload
 $datum | Add-Member –MemberType NoteProperty –Name UserId –Value $d.UserId
 $datum | Add-Member –MemberType NoteProperty –Name ClientIP –Value $d.ClientIP
 $datum | Add-Member –MemberType NoteProperty –Name UserAgent –Value $d.UserAgent
 $datum | Add-Member –MemberType NoteProperty –Name Activity –Value $d.Activity
 $datum | Add-Member –MemberType NoteProperty –Name ItemName –Value $d.ItemName
 $datum | Add-Member –MemberType NoteProperty –Name WorkSpaceName –Value $d.WorkSpaceName
 $datum | Add-Member –MemberType NoteProperty –Name DashboardName –Value $d.DashboardName
 $datum | Add-Member –MemberType NoteProperty –Name DatasetName –Value $d.DatasetName
 $datum | Add-Member –MemberType NoteProperty –Name ReportName –Value $d.ReportName
 $datum | Add-Member –MemberType NoteProperty –Name WorkspaceId –Value $d.WorkspaceId
 $datum | Add-Member –MemberType NoteProperty –Name ObjectId –Value $d.ObjectId
 $datum | Add-Member –MemberType NoteProperty –Name DashboardId –Value $d.DashboardId
 $datum | Add-Member –MemberType NoteProperty –Name DatasetId –Value $d.DatasetId
 $datum | Add-Member –MemberType NoteProperty –Name ReportId –Value $d.ReportId
 $datum | Add-Member –MemberType NoteProperty –Name OrgAppPermission –Value $d.OrgAppPermission

#option to include the below JSON column however for large amounts of data it may be difficult for PBI to parse
 #$datum | Add-Member –MemberType NoteProperty –Name Datasets –Value (ConvertTo-Json $d.Datasets)

#below is a poorly constructed PowerShell statemnt to grab one of the entries and place in the DatasetName if any exist
 foreach ($dataset in $d.datasets) {
 $datum.DatasetName = $dataset.DatasetName
 $datum.DatasetId = $dataset.DatasetId
 }
 $data+=$datum
}

$datestring = $startDate.ToString("yyyyMMdd")
$fileName = ("c:\PBIAuditLogs\" + $datestring + ".csv")
Write-Host (" writing to file {0}" -f $fileName)
$data | Export-csv $fileName

Remove-PSSession -Id $Session.Id
Notice that you need to enter O365 audit log privileged credentials at the top so that this can be ran automatically. If you have more clever ways to pass these credentials in so they are not exposed in the file by all means, do that
The Do/Until loop handles if there are more than 5000 records in the result set which would easily be the case for a large Power BI community.
The foreach loop extracts the AuditData column JSON format and creates an individual record for each entry. This makes the Query Editor in Power BI less complex and easier to accomplish retrieving several hundred thousand records without import errors
finally we create a CSV for the data with the date of the file entries (yesterdays info if this is ran at midnight every day). This dumps each file in c:\PBIAuditLogs. You can obviously change this file location to wherever you want to store your CSV extracts
You can use Task Scheduler to run the above PowerShell script every night at midnight.
The PBIX file
In the Power BI file, we are connecting to the content of the entire folder shown above. I went ahead and included the PBIX file WITH the sample data so you could get an idea of what your data may look like.
This is where i have to admit that i tried to use a parameter for this but ran into some Query Editor challenges with how Power BI creates a Sample File transform to import multiple files from a single folder. If you can see what i did wrong here I would love your feedback, but for now, you can ignore the file directory parameter in the Query Editor and need to go to “Advanced Editor” on the “AuditLog” query and modify the file location to be the location you are dumping files from the PowerShell script.
Change the below file location as needed.
Once you have made this change, you should be able to “Close and Apply” and your data will now be populated in this basic audit log analytics view.
Using the file
I created a couple basic pages to get this blog post shipped and so you can start taking advantage of the solution, but it is nowhere near as complete as you can eventually make it. I have a simple overview page that was screenshotted above. It can help you determine number of active users, reports, dashboards, and datasets being used for any time period your audit log data covers.
The second page is a user activity view I created from a calculated table. It helps you determine which users in the system may be inactive so you can re-assign power bi licenses and also shows detailed activity for an individual user that you can select from the slicer.
Other things you can mine from this data:
Who has signed up for Free Power BI trials
What “Apps” are being created
what embed tokens are being generated and used
many other possibilities
The PowerShell script and the PBIX file are located on my GitHub here…
Microsoft has expanded sharing by allowing users to share Power BI content via email. In a previous post, I discussed how sharing content within your organization should be handled carefully. However, the new process opens up the opportunity to share outside your organization by sending an email. In particular, you can now share with users who have a personal email address such as @outlook.com and @gmail.com. Let’s dig into the implications of this capability.
Sharing Using Email
First, you need to be aware that this functionality is as simple as the original methods of sharing. You click the Share button on your report or dashboard to open the Share dialog.
The Share report dialog in this case accepts email addresses which is not a significant change. However, as shown below, you can add personal emails and emails outside your organization. You be warned, but users do not always pay attention to this or understand the implications.
You will also notice that consumers need to still have a Power BI Pro account assigned to them or you need to be using Power BI Premium for this to work.
Following the Email Process
When you share, you usually will need to send an email to the recipient. Here is the email content.
Time to click the report link. This opens a series of dialogs which determine how much you have access. It is important to note that this is all made possible with Azure B2B. More about that in a moment. Let’s trace the story through. The link opens the following page.
As you can see, the next step is to log in. I am using an outlook.com account so it prompts me to authenticate. Once I have authenticated, I get the following notice.
My account does not have Power BI Pro, but now I can try it for free for 60 days and get access to the data while I am on the trial. I clicked both options, because I can. The Upgrade account option would require me to pay for Pro. However, Try Pro for free works and I was able to access the report fully. I have successfully shared my corporate content with a personal user.
Preventing Sharing Outside Your Organization
While in some cases, you need to share outside your organization, we will assume here you need to disable this functionality. There are a few places you can make this happen.
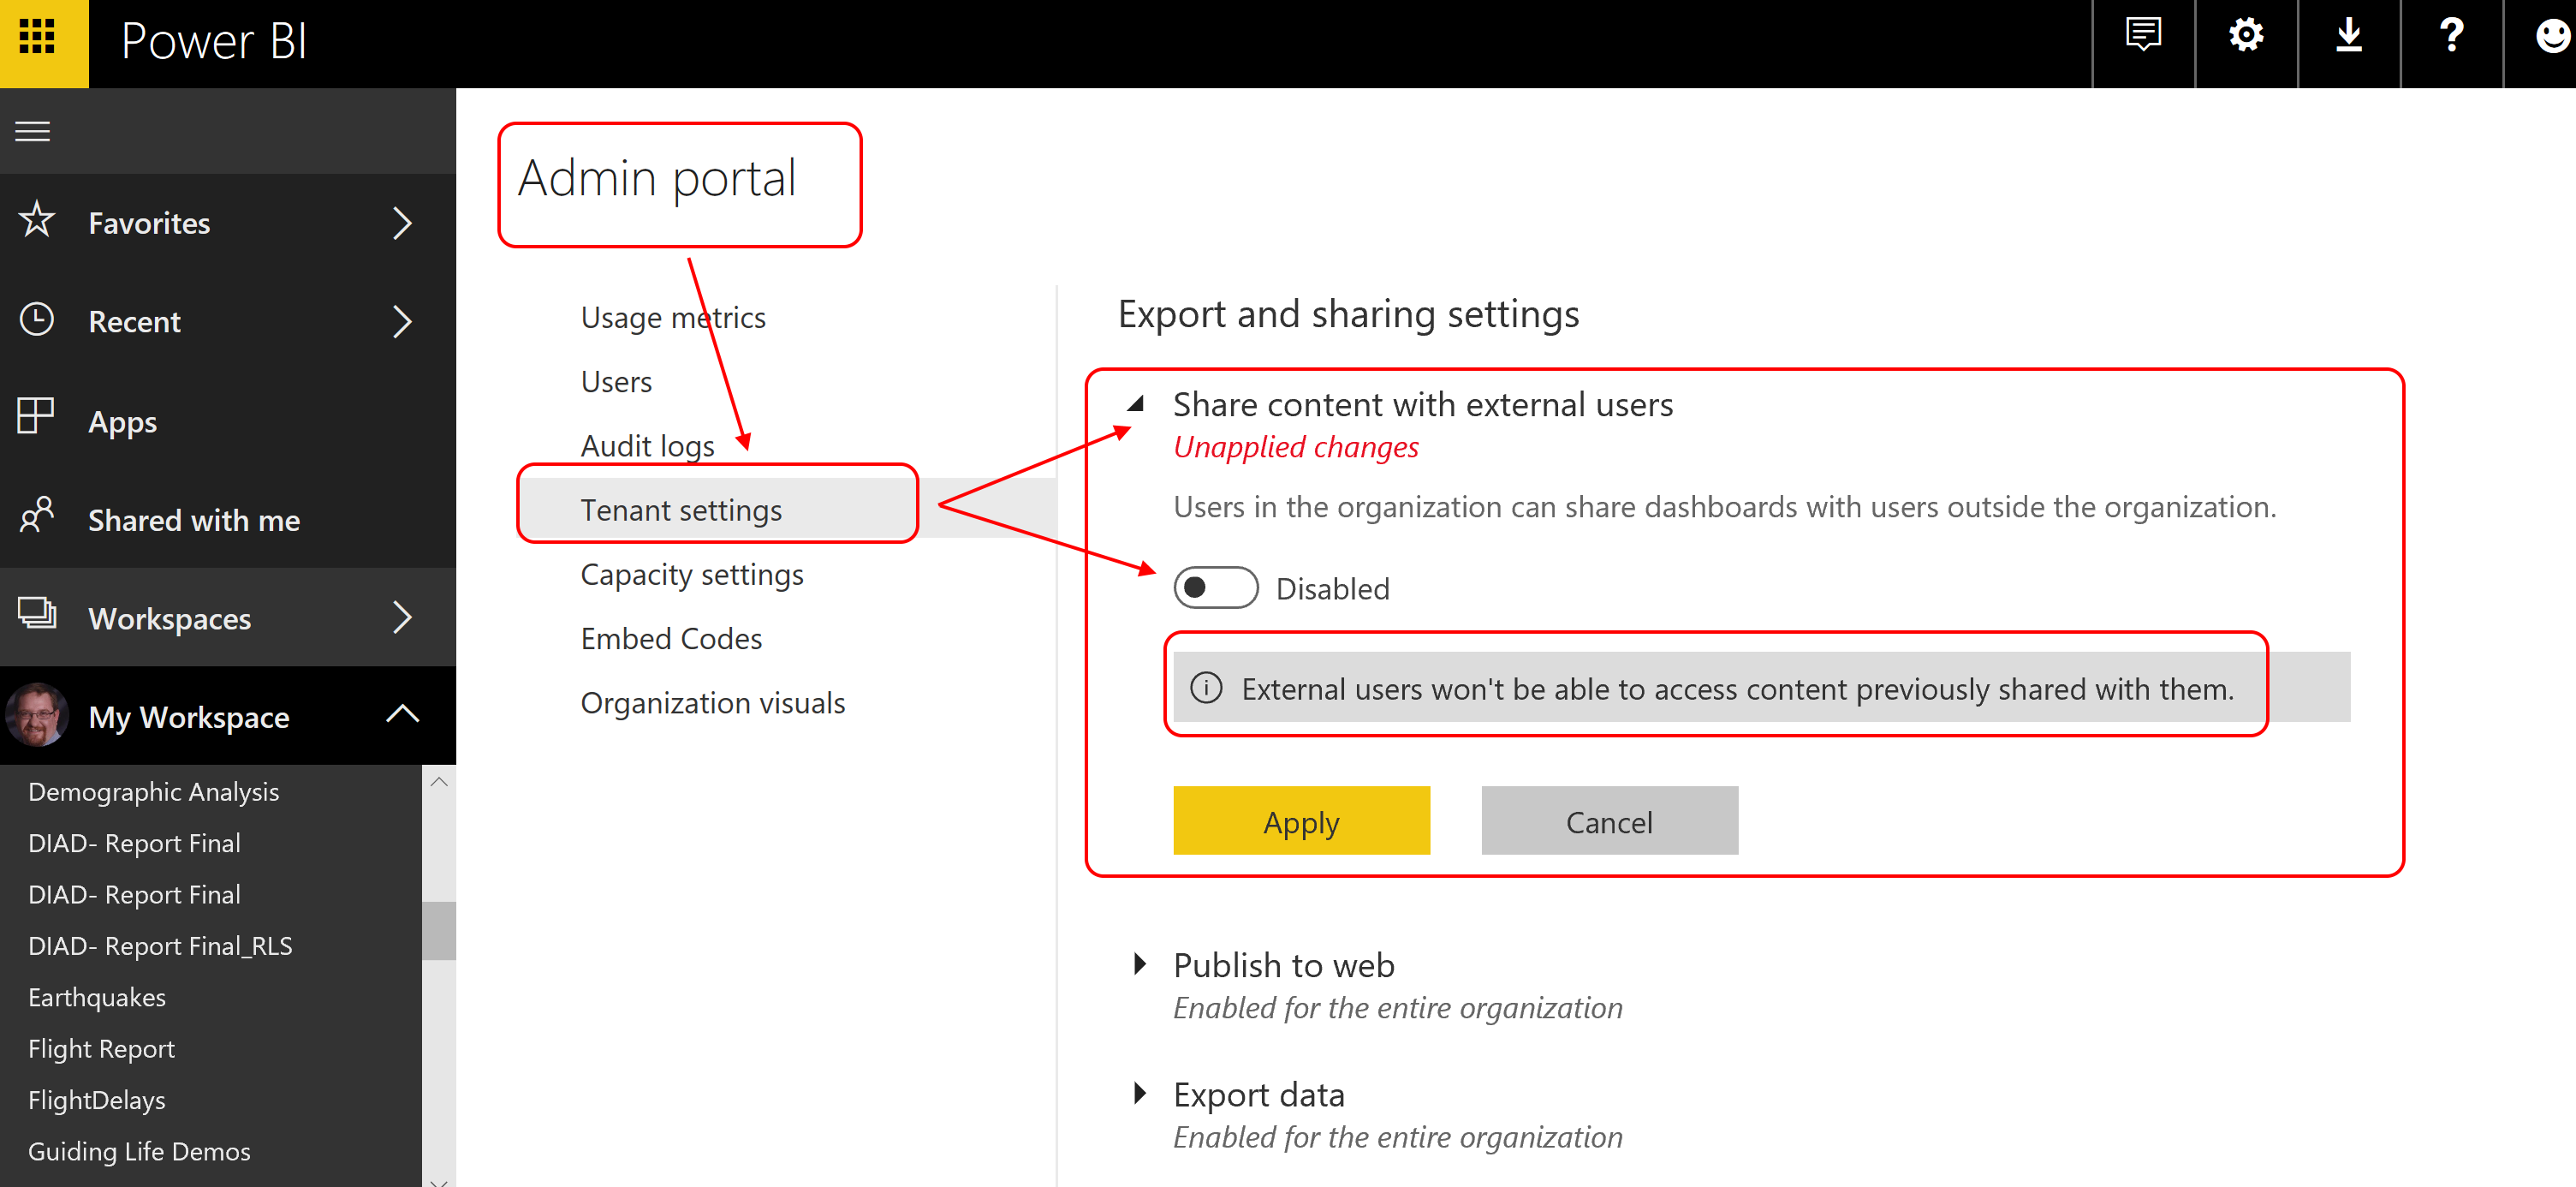
Power BI Admin Portal
First, in Power BI go to the Admin portal and disable sharing outside your organization. If you have followed my previous advice, this will already be disabled.
As you can see, this will disable content for users who have been shared with previously. If you need to share, you can specify groups that have that permission.
Office 365 Admin Center
Next, this can be turned off in the Office 365 Admin Center in the Security and privacy area.
This prevents the ability to add guest users to the organization. This will disable this capability across Office 365. There is no option to allow some users this access. Once this is disabled, sharing outside the organization which requires a guest user will not be possible.
Azure Active Directory
Finally, you can shut this down from Azure Active Directory. Guest users are ultimately managed through Azure Active Directory and this is the best place to turn this off corporately if you do not need this functionality.
In AAD you have four options.
Guest users permissions are limited. This limits guest user capabilities with regard to the directory. Yes is the default and recommended.
Admins and users in the guest inviter role can invite. This would be a typical option we can understand. However, it is important to note that Admin users in Power BI workspaces will have the ability to create guest users and share reports externally with this permission on.
Members can invite. Just like it sounds. Any member of a group can invite guest users in.
Guests can invite. This allows guests to invite other guests. Seems dangerous to me.
As you can see from my tenant, the options are all on which is the default. Be sure to understand what capability you want to use and set it appropriately within your tenant.
Tracking Sharing
In the Office 365 logging, you can see who and what has been shared. This log covers internal and external shares and should be monitored for auditing and compliance purposes.
Azure B2B
Azure B2B and the sharing capabilities in Power BI go hand in hand. This allows organizations to share content in a controlled fashion to consumers outside their organization. While this is required for certain scenarios, be mindful of who has the capability to share, and track sharing to make sure the data is being handled as you require.
Final Thoughts and References
You need to remember that sharing is at the heart of Power BI and you need to manage how and who can share. If you need to do more extensive sharing, by all means, use these features. For those, who need to lock it down tighter, you can follow the steps above to prevent sharing until you have a process and pattern. Power BI continues to improve and grow and as that happens we can expect more security options to support the new functionality. Enjoy Power BI, it is a great tool and will only continue to get better.


 Time to click the report link. This opens a series of dialogs which determine how much you have access. It is important to note that this is all made possible with Azure B2B. More about that in a moment. Let’s trace the story through. The link opens the following page.