Using Power BI with HDInsight Part 2: Power BI Desktop and Hive

With the rise of HDInsight and other Hadoop based tools, it is valuable to understand how Power BI can help you take advantage of those big data investments. If you need to set up a cluster to work with, check out my previous posts on Setting Up an HDInsight Cluster and Loading Data Into Your New HDInsight Cluster. These posts show how to do this with no scripting required. If you prefer to script, there are a number of resources with sample scripts on doing the same work.

In this article, I will focus on using Power BI Desktop to get data from the Hadoop file structure in HDInsight using a Hive query. I will also be using the restaurant data I loaded as noted in the previous posts. If you need to create a cluster and load data I encourage you to check the following blog posts:

These posts walk through the process of creating a cluster and loading up data.

Connecting to HDInsight Using the Hive ODBC Driver

Before you can connect using a Hive query you need to download the Hive ODBC Hive from Microsoft.  You can find the driver here: http://www.microsoft.com/en-us/download/details.aspx?id=40886. Once you have the driver installed, the connection can be created.

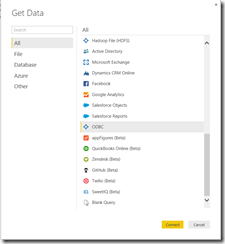
Open Power BI Desktop and click Get Data on the splash screen. This will open the Get Data dialog. Scroll down until you see the ODBC option. (Do not select a Hadoop or HDInsight option. See my previous post on connecting using HDInsight.)

image

Click Connect to start the process.

image

Here is where the “fun” begins. You get no help creating a Hive connection string. It took some searching and trial and error to figure out what was needed to make this happen. Here are the properties you need:

  • Driver:  Driver={Microsoft Hive ODBC Driver}
  • Host: Host=yourHDInsightservername.azurehdinsight.net (Your HDInsight server name)
  • Port: Port=443
  • Schema: Schema=default (default Hive database schema)
  • RowsFetchedPerBlock: RowsFetchedPerBlock=10000 (This is the default)
  • HiveServerType: HiveServerType=2 (This is the default)
  • AuthMech: AuthMech=6
    • This is the Authentication Mechanism which is Windows Azure HDInsight Service.
  • DefaultStringColumnLength: DefaultStringColumnLength=200 (Default is 32767, this should always be set lower)

Each property is separated by a semicolon. My completed connection string looked like this (Note: I added spaces to fit better in the post.):

Driver={Microsoft Hive ODBC Driver}; Host=hugheshdinsight.azurehdinsight.net; Port=443;Schema=default; RowsFetchedPerBlock=10000; HiveServerType=2; AuthMech=6; DefaultStringColumnLength=200;

Enter the connection string into the dialog and then you will be prompted for credentials. Use the Database option and set the Username and Password. Then click Connect. In my case, I see three tables in the resultset including the sample table. We have connected to our HDInsight cluster using Hive.

image

Retrieving Data from HDInsight Using HiveQL

So, getting a list of tables is not really helpful. As you can see, this is the Power Query portion of the Power BI Desktop. Let’s add a HiveQL statement to return only our sales data.

In Applied Steps, click the gear next to Source. This will reopen the From ODBC dialog. Expand the SQL Statement portion and add a SELECT * FROM yourtable  to get our desired result set. Click Ok and check the results again. You should see the tablename.fieldname format for column headers. At this point, you can proceed with more data shaping and prep data for other analytics. Click Close and Load when you are done and it will load the data into the Power Pivot designer in Power BI desktop.

I hope you enjoyed this series through HDInsight and Power BI. It was a great learning experience for me.

Using Power BI with HDInsight Part 1: Power Query and Files

With the rise of HDInsight and other Hadoop based tools, it is valuable to understand how Power BI can help you take advantage of those big data investments. If you need to set up a cluster to work with, check out my previous posts on Setting Up an HDInsight Cluster and Loading Data Into Your New HDInsight Cluster. These posts show how to do this with no scripting required. If you prefer to script, there are a number of resources with sample scripts on doing the same work.

In this article, I will focus on using Power Query to get data from the Hadoop file structure in HDInsight. I will be using Excel 2013 with the Power Query Add-In. I will also be using the restaurant data I loaded as noted in the three previous posts. If you need to create a cluster and load data I encourage you to check the following blog posts:

These posts walk through the process of creating a cluster and loading up data.

Connecting to HDInsight

First, open a new Excel workbook and click the Power Query tab. Once there, you can find the Azure HDInsight source in the From Other Sources dropdown. Select that option to open the following dialog:

image

You will need your storage account in order to continue. Then you will need the storage account key. Once you have added the key you will see that the Navigator opened in Excel on the right.

image

It should show the name of your cluster and the default container name. Double click the container name and it will open the Power Query window. It will show all the files available in the container. Even though we have it organized in folders, the view shows all the files. If you have a large amount of files and you don’t want to scroll to find them, you can click the down arrow on the Folder Path column and use the text filter to find the folder you are looking for.

image

Now I have the files I want to use in Power Query. If you click the binary link it will open a copy of the file. However, this is not how we want to work with the data as we have multiple files. (If you did this, remove steps up to the Filtered Rows step in the Applied Steps section.) I now have the files I uploaded showing.

image

In order to work with them all together we need to Combine Binaries.

image

This now merges all the files into a single dataset. You can now do any data shaping you would like using standard Power Query methods such as updating the column names and the data types. You can even add columns such as a Total Amount column. Here is what my final query looks like including the steps I did. Be sure to give your query a meaningful name. (Note that Power Query realized my Transaction Date column was a date dataype and changed it for me.)

image

Now click Close & Load and your data will be loaded into Excel. You can change the query to load a model in Power Pivot as well to do additional work with the data.

The next post will walk through using Power BI Desktop to load data using a Hive query.

Setting Up an HDInsight Cluster (No Scripts Required)

Let me start by saying, I am not a fan of scripting. It definitely has its place and a lot of my peers really like it. It is the easiest way to get functionality out from software vendors such as Microsoft. PowerShell is an incredibly powerful tool which can do just about anything. However, therein lies the problem for me. Scripting solves a lot of problems, however, I just wanted to set up and use a basic HDInsight cluster to create some Power BI demos (posts coming soon). So I started the journey to find the scripts and try to understand the syntax and so on. Then I went to the Azure Portal, here is what I did to set up my cluster and load data with no scripting required. My goal was to go to get a working demo platform up. Would I necessarily recommend this path for production work, not sure yet. But now I can work with HDInsight with considerably less work required to set up the environment.

HDInsight Cluster No Script Setup Requirements

You need an Azure account. You can go to http://azure.microsoft.com to sign up for a free account if you like. If you have an MSDN subscription you should have some time available as well.

HDInsight Cluster No Script Setup

Once you have your account created, you should go to http://portal.azure.com. We will be doing our setup from here. During the process we will be creating a storage account (if this is your first run in azure, you may choose to set up a Resource Group as well) and the HDInsight cluster. Be aware that the cluster has compute costs and the storage has storage costs. At the end we will remove the cluster to save your compute time.

Create the Storage Account

This step can be done during the HDInsight cluster creation, but this limits your ability to share data across clusters. If you are just trying it for fun, you can do this during the cluster set up.

Click the + symbol on the portal, then Data + Storage, then Storage Account. This will open a blade with the set up instructions for a storage account.

image

When you create your account you will have some options to fill in:

  • Name: this name will need to be a unique name, e.g., joescoolhdinsight
  • Pricing tier: The pricing tier is really important if you are using a limited plan or if you plan to keep the data for a long time. If you are planning to use this as a demo, I would select Locally Redundant as that is the lower cost plan.
  • Resource Group: The resource group lets organize your Azure assets. This is for your benefit, so if you want to keep all of the HDInsight components together, you could create a group for that or stick with the default.
  • Subscription: This lets you choose the subscription you want to use.
  • Location: Be sure to select a location close to you that supports HDInsight. Check http://azure.microsoft.com/en-us/regions/ to see what Azure services are supported in each region.
  • Diagnostics: This is optional. If you are looking into the diagnostics or need to prep for production, you will find this useful. In most cases, we would not turn this on for demos.

Click Create and it will create your storage account. This may take a few minutes. The notifications section on the portal will alert you when this has been completed. Once that is complete, we will continue with setting up the cluster.

Create a SQL Database for a Metastore

This is an optional section. If you would like to use Hive or Oozie and want to create a metastore so you can reuse your work when you recreate the cluster you need to create a SQL Database for this.

image

Here are the settings needed to create the database:

  • Name: Something easy for you to track on, e.g. HDInsightMetastore.
  • Server: You can use an existing server if you have it, otherwise you can create a new server. I recommend you create the server in the same location you plan to create your HDInsight cluster.
  • Pricing Tier: The default is S0. If you plan to use this for demos and don’t need the additional features, you can choose Basic.
  • Optional Configuration: no changes.
  • Resource Group: Use the Resource Group you have in place for this example.
  • Subscription: Select your subscription.

Click Create to create your database. You will work with this during the setup of your cluster.

Setting Up the HDInsight Cluster

Click the + symbol on the portal, then Data + Analytics, then HDInsight. This will open a blade with the set up instructions for a storage account.

image

Like with the storage account setup, this will open a blade with options for creating the cluster. Let’s walk through the settings on this.

  • Cluster Name: Like the storage account, this name needs to be unique.
  • Cluster Yype: Select Hadoop for this walk through.
  • Cluster Operating System: Select Windows Server for this walk through.
  • Subscription: Choose the same subscription as your storage account.
  • Resource Group: Choose the same Resource Group as your storage account.
  • Cluster Credentials: Here you select a login name and password for your cluster. You can also choose to enable Remote Desktop, but we are not using that feature for this setup. (Note: be sure to click Select at the bottom when you are done. If you don’t, you will be prompted by IE about unsaved settings.)
  • Data Source: Here is where you select your storage account. If you chose not to create a storage account, you can create a new account here as well.
  • Node Pricing Tiers: This section determines the capability and the associated computing costs of your cluster. By default, 4 worker nodes and 2 head nodes will be created with recommended servers (D12 at the time of this writing). Expand the pricing tier, to change the server type or node count. Unless you are sure you need to change, keep the default settings (you can recreate the cluster later). You will see the current hourly pricing based on your selections. This cost is incurred while the service is running. The only way to stop charges is to delete the cluster, so be sure to do this when you are done if you do not wish to pay for it to keep running.
  • Optional Configuration: You do not need to change any setting here if you choose not to. However, if you plan to delete your cluster and you want to retain the metadata, it is recommended that you set up an External Metastore using the database you created previously.
    • Select the database you want to use for the metadata in each case and update the credentials. You can use the same database for both metastores.

Next, you create the cluster. This will take a few minutes. You can track progress in the notifications section on the portal page.

Exploring Your New HDInsight Cluster

Once the cluster has been created, you will see the information page with the settings and other usage information. At the top of that area, you will see some icons. These will help you explore your cluster some more.

image

The gear will open up a settings page and you can review your settings in detail and change some if needed.

The icon with a square and an arrow will open up a dashboard with more options. We will dig into the dashboard more in the next post.

The last three icons are shortcuts to specific actions – remote desktop, scale cluster, and delete.

Once you are done, you should delete your cluster. You can always go through these steps again to recreate your cluster. In my next article we will go through what you can see and do with your cluster using the dashboard.

2013 – A Year In Review

It is in our nature as humans to look back in order to understand where we have been.

Warning – some of this blog contains stuff about my family… In case you only want the technical stuff.

Family Fun

This past year has been very interesting for me personally and professionally. In the past year, my youngest, Mikayla, has entered Junior High officially taking our family out of elementary schools. Mikalya joined me at the SQL Saturday event in Omaha. At the same time, my oldest, Kristyna, is now a senior at Burnsville Senior High School. Both of my boys, Alex a junior and Andrew a freshman, are both taller than me and staying active. Alex joined us at the Minnesota SQL Saturday and did a lot of volunteering. Andrew probably had the best event of all as he joined me at SQL Saturday in Fargo. There he got to see Bill Gates in person. I am proud of all of them, they are great kids. This was also the year I celebrated 20 years with the woman I love, Sheila. Without her support, I would not have been able to get this far in my career as well. Yep, it has been a busy year personally. Soon there will be lots of college, marriage, and maybe even grandkids. Wow, I must be getting old.

Magenic and the Server Development Practice

2013 is my first full year as a Practice Lead at Magenic. I started out as the Practice Lead for our Business Intelligence and Data Practice. In August, my role expanded to include SharePoint, Biztalk, and TFS. This allows us to focus server technologies at Magenic. Along  the way, I have had to learn a lot about VMs (still a work in progress). I really enjoy working with the pros across the company that we have. We some very talented BI, SharePoint and BizTalk consultants including a few virtual TSPs in SQL Server, Business Intelligence, and BizTalk.

During this past year, I have traveled around the country to consult, to speak, and to meet customers. I have had the privilege of speaking at multiple SQL Saturdays, Modern Apps Live, SQL Live, and Code Mastery events. It has been fun. I almost made it to all of our offices including the locations we opened this year. I made it to Minneapolis, Chicago, Atlanta, Charlotte, Boston, New York City, and San Francisco. Still need to get out to Los Angelos and Manila.

image

While it has been hard at times, the travel experience has been good overall. I try to keep my speaking engagements up to date, maybe I will see some of you next year.

This year I also authored outside of the blog. Chuck Whittemore (The Insight Analyst)The Changing World of Business Intelligence: Leading with Microsoft Excel - Custom Software Development White Paper and I coauthored a white paper on Leading with Excel: The Changing World of Business Intelligence. This was a fun project where we bring together Microsoft Excel and Microsoft BI in a real world way. We continue to successfully work this strategy with our customers and it was the impetus for my Excel BI Tips blog post series. I SQL Server Analysis Services 2012 Cube Development Cookbookalso had the privilege to coauthor a book that is just being released: SQL Server Analysis Services 2012 Cube Development Cookbook by Packt Publishing. This the third book I have worked on and it has been a while since was last published so this was a good experience for me. I still don’t know if I would take an entire project on, but maybe someday.

This year wraps up with me becoming a virtual TSP with Microsoft to further support their efforts with SQL Server and Business Intelligence in the marketplace.

One other thing that has been interesting for me is that with the release of Power Pivot and SQL Server Analysis Services Tabular Model, I am seeing a huge shift in how I work with and sell BI. I have always worked with cubes, but now I see the in-memory space as a more compelling and leading edge solution that will continue to change what my career will look like. While I had a lot of fun being a cube and MDX wizard, the ability to deliver results to business users in a timely fashion with great visualizations is actually more fun. The more things change …

Happy New Year!

I hope you and your family had much to look back and celebrate this year. I thank God for the blessings of a great company to work for and an awesome family to be with.

The Changing World of BI, A New White Paper for Magenic

MagenicLogo2012x70tallIn the ever changing landscape that is Business Intelligence (or is that Business Analytics?), a fellow business analyst from Magenic, Chuck Whittemore (B), and I authored a white paper based on our experiences over the past months.

What I think makes our work unique, a BI architect and a business analyst came together to show our worlds colliding in the age of modern BI tools.  While the goal has always been to bring the data to the users and let them work with it as creatively as possible, the tools to do this were IT focused.  What we see now is that with the advent of in-memory, client-side BI tools, users are now able to get to this on their own.  Microsoft has invested heavily in Excel to make it a first-class BI tool.  Our paper discusses this disruptive nature of the new tools and how Excel is being pushed to the next level.  After all, Excel is everywhere already.

Enjoy the read and I welcome your feedback.

The Changing World of Business Intelligence: Leading with Microsoft Excel