
Dynamic measures are an effective way to avoid crowding your report with different versions of the same visual without using bookmarks. No disrespect to the versatility of bookmarks, but they can quickly clog up reports with the amount of visuals used and can be a headache to modify depending on the complexity. This post will explore when to use dynamic measures, how to set up your data model to accommodate them, how to implement them, and limitations.
A primary use case for dynamic measures is when you have multiple business owners looking at a report who each want to see the report in slightly different ways.
For example, you may have three major stakeholders looking at a report: CEO, CFO, and COO. The CEO may be more interested in future profits and looks at trends in the number of loads booked to see where we are headed. The CFO wants to see profit trends on loads that have already been completed (actualized profit). Additionally, the COO would rather see what’s currently in transit and look at only picked up loads. You could make three pages, one based on booked loads for the CEO, another based on delivered loads for the CFO, and one based on picked up loads for the COO. But what happens if your report is already going to be multiple pages and needs room to grow? You would need to triple your page count to accommodate the needs of your users or build three completely separate reports! Don’t worry, dynamic measures can solve this problem for you without clogging up your reports or workspaces with extra measures, visuals, and reports.
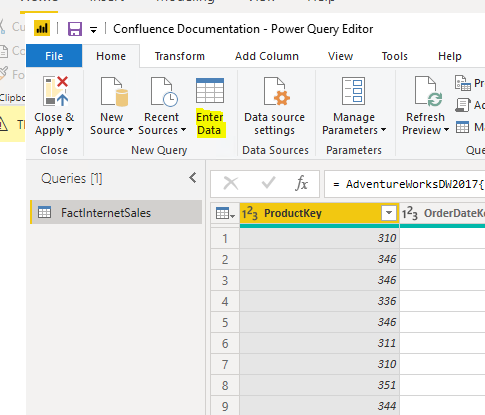
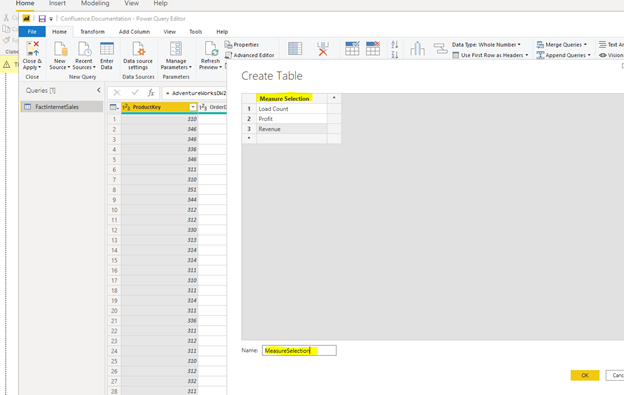
In order to use dynamic measures, you will need to set up your data model with some tables for the singular purpose of selecting the dynamic measure. You will also need to have a few measures that will correspond with those filters. For example, if you are want the end users to choose between seeing load count, profit, and revenue, you will need to make a table that contains all three of those fields as rows. The easiest way to do this is to go into the Power Query editor and use the “Enter Data” option. Make sure that your options are exactly as you’d like them displayed for your end users and are in a table that’s easy to reference.
Hit close and apply. Once your new table is loaded, you DO NOT need to connect it to your other data in the data model. Dynamic measures work because they do not rely on relationships between the filter and the data, but on the selection of measures to be used. You have a couple options here, you can build each of these measures separately or build them once within the dynamic measure itself. There are reasons to do both, so we will build out both examples. Having separate measures offers you lots of flexibility down the road, but if you are only using these measures within the dynamic measure then it’s best to keep it all within the dynamic measure to save some space and increase efficiency in your DAX queries.
Building the Dynamic Measure
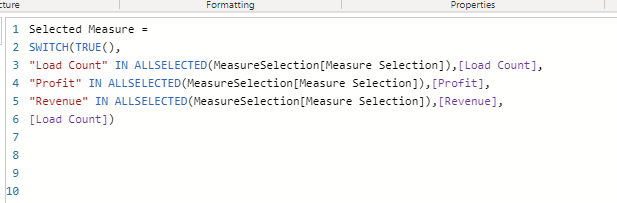
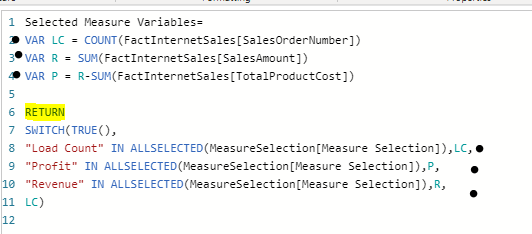
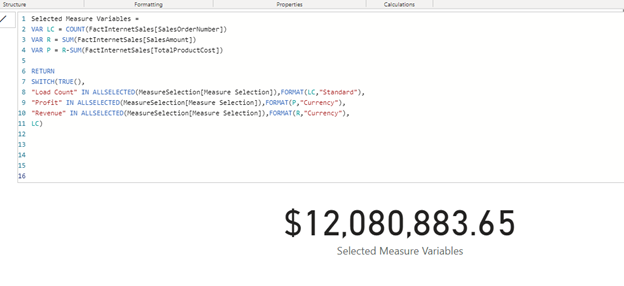
After you have your desired measures built out, you can reference them inside your dynamic measure either by using separate measures or variables. The key expression in dynamic measures is an IN ALLSELECTED combination. It’s vital to know exactly how your options were spelled inside your recently make custom table because you will need to spell them out within the dynamic measure. The basic syntax is as follows:
Selected Measure =
SWITCH(TRUE(),
“Option1” IN ALLSELECTED(CustomTable[ColumnName]),[Option1Measure],
“Option2” IN ALLSELECTED(CustomTable[ColumnName]),[Option2Measure],
“Option3” IN ALLSELECTED(CustomTable[ColumnName]),[Option3Measure],[DefaultMeasure])
If your dynamic measure is being used to filter a selected field instead of choosing a completely different metric, I recommend using a variation of the following syntax:
Selected Measure =
VAR A =
SWITCH(TRUE(),
“Option1” IN ALLSELECTED(CustomTable[ColumnName]),[Filter1],
“Option2” IN ALLSELECTED(CustomTable[ColumnName]),[Filter2],
“Option3” IN ALLSELECTED(CustomTable[ColumnName]),[Filter3],[DefaultFilter])
RETURN
CALCULATE([Measure],FILTER(Table,Table[FilteredColumn]=A)
Using separate measures:
Using variables:
Using the switch function in conjunction with the IN ALLSELECTED allows the end user to “switch” their selection with the measure associated with it.
Using the Dynamic Measure
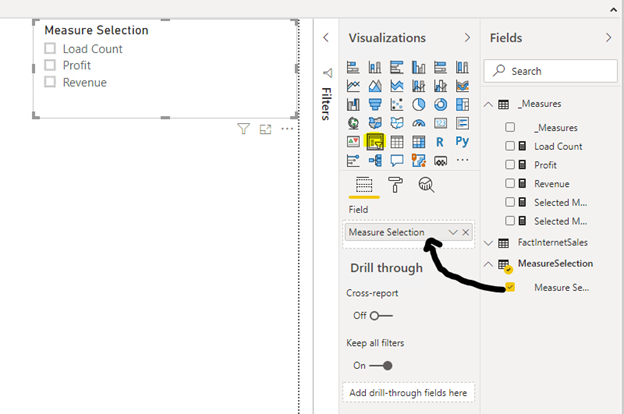
To use a dynamic measure, you’ll need to first build a slicer with your custom table you made earlier and referenced inside your dynamic measure.
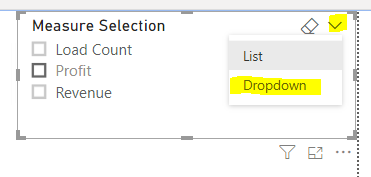
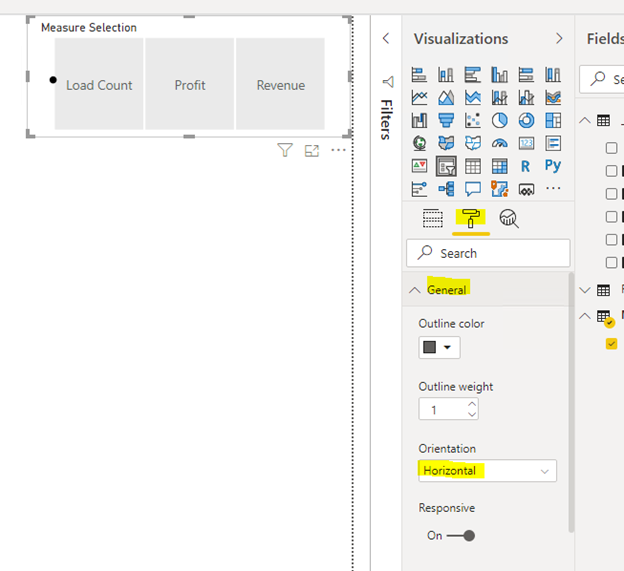
Depending on how many options you have, it may be wise to format this slicer as a drop down or as a horizontal list to make it appear more like buttons.
To test your dynamic measures, let’s throw it into a card visual then select a couple different options to make sure it’s choosing the correct measure.
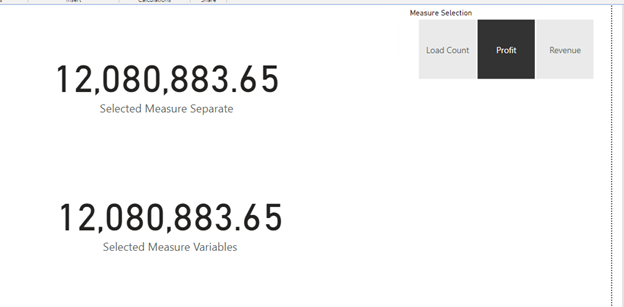
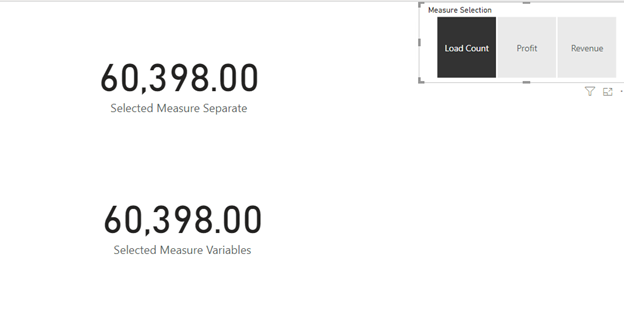
Perfect, working like a charm! From here, any visuals you build using these dynamic measures will adjust when users select their metric. Be sure to carefully label your visuals so it’s clear that what they are looking at will change depending on what they have selected. If you would like to have your profit and revenue to have ($) signs in front of the metrics, just build that formatting into the measure itself using FORMAT. In the example below, format is used to set profit and revenue as currency while load count is a standard number (comma separated). For more formatting options see the following documentation from Microsoft: https://docs.microsoft.com/en-us/dax/pre-defined-numeric-formats-for-the-format-function.
Now when you go to build your report, instead of 3 duplicate pages use this dynamic measure in all your visuals and place the slicer at the top of the page for various users to interact with at will.

Pingback: Dynamic Measures in DAX – Curated SQL