Power BI and Data Security – Audit Logs, Powershell, Power BI and @AngryAnalytics

The following has been reposted with permission from Steve Howard a.k.a. @AngryAnalytics. I have made some formatting changes but the content is unchanged. Thanks again to Steve for allowing me to repost this content. You can find the original post and the rest of Steve’s great work on his blog.

Power BI Audit Log Analytics Solution

As Power BI adoption in your organization grows, it becomes more and more important to be able to track the activity in the environment.

When you start to think about deploying a Power BI Audit Log solution that is repeatable there are a few challenges that you will face.

  • Going to the O365 Audit Logs portal each time you want to extract log events is a manual process and doesn’t scale
  • When automating this process through API or PowerShell, there is a limit to how much data you can pull, therefore examples that are currently available also don’t scale very well
  • The AuditData field is a JSON format by default and although Power BI can parse JSON beautifully, when doing this over several thousand record entries may result in data load errors

Based on these factors, i have put together a PowerShell script that can be scheduled on a nightly basis that can iterate MORE than 5000 records so that no data is lost. Also, the screenshot below is of an initial template that you can use to start with to analyze your audit logs for your organization.

TL;DR

  • The required files can be found on my GitHub
  • Update the PowerShell script with a UserID and Password that has O365 audit log privileges
  • Use Task Scheduler to schedule the PowerShell script to run each night at midnight (run as admin).
  • At the end of the script, specify the directory you would like the script to generate CSV files in
  • In the PBIX file, it was challenging to get a parameter to work for the file location that the CSVs are in, so in the Query Editor the script for the AuditLog table needs to be manually modified to include your file path.
  • Enjoy

Quick look at the PowerShell

First, there is a PowerShell script.

Set-ExecutionPolicy RemoteSigned

#This is better for scheduled jobs
$User = "<<enter o365 admin user email here>>"
$PWord = ConvertTo-SecureString -String "<<enter password here>>" -AsPlainText -Force
$UserCredential = New-Object -TypeName "System.Management.Automation.PSCredential" -ArgumentList $User, $PWord

#This will prompt the user for credential
#$UserCredential = Get-Credential

$Session = New-PSSession -ConfigurationName Microsoft.Exchange -ConnectionUri https://outlook.office365.com/powershell-liveid/ -Credential $UserCredential -Authentication Basic -AllowRedirection
Import-PSSession $Session

$startDate=(get-date).AddDays(-1)
$endDate=(get-date)
$scriptStart=(get-date)

$sessionName = (get-date -Format 'u')+'pbiauditlog'
# Reset user audit accumulator
$aggregateResults = @()
$i = 0 # Loop counter
Do { 
 $currentResults = Search-UnifiedAuditLog -StartDate $startDate -EndDate $enddate `
 -SessionId $sessionName -SessionCommand ReturnLargeSet -ResultSize 1000 -RecordType PowerBI
 if ($currentResults.Count -gt 0) {
 Write-Host (" Finished {3} search #{1}, {2} records: {0} min" -f [math]::Round((New-TimeSpan -Start $scriptStart).TotalMinutes,4), $i, $currentResults.Count, $user.UserPrincipalName )
 # Accumulate the data
 $aggregateResults += $currentResults
 # No need to do another query if the # recs returned <1k - should save around 5-10 sec per user
 if ($currentResults.Count -lt 1000) {
 $currentResults = @()
 } else {
 $i++
 }
 }
} Until ($currentResults.Count -eq 0) # --- End of Session Search Loop --- #

$data=@()
foreach ($auditlogitem in $aggregateResults) {
 $datum = New-Object –TypeName PSObject
 $d=convertfrom-json $auditlogitem.AuditData
 $datum | Add-Member –MemberType NoteProperty –Name Id –Value $d.Id
 $datum | Add-Member –MemberType NoteProperty –Name CreationTime –Value $auditlogitem.CreationDate
 $datum | Add-Member –MemberType NoteProperty –Name CreationTimeUTC –Value $d.CreationTime
 $datum | Add-Member –MemberType NoteProperty –Name RecordType –Value $d.RecordType
 $datum | Add-Member –MemberType NoteProperty –Name Operation –Value $d.Operation
 $datum | Add-Member –MemberType NoteProperty –Name OrganizationId –Value $d.OrganizationId
 $datum | Add-Member –MemberType NoteProperty –Name UserType –Value $d.UserType
 $datum | Add-Member –MemberType NoteProperty –Name UserKey –Value $d.UserKey
 $datum | Add-Member –MemberType NoteProperty –Name Workload –Value $d.Workload
 $datum | Add-Member –MemberType NoteProperty –Name UserId –Value $d.UserId
 $datum | Add-Member –MemberType NoteProperty –Name ClientIP –Value $d.ClientIP
 $datum | Add-Member –MemberType NoteProperty –Name UserAgent –Value $d.UserAgent
 $datum | Add-Member –MemberType NoteProperty –Name Activity –Value $d.Activity
 $datum | Add-Member –MemberType NoteProperty –Name ItemName –Value $d.ItemName
 $datum | Add-Member –MemberType NoteProperty –Name WorkSpaceName –Value $d.WorkSpaceName
 $datum | Add-Member –MemberType NoteProperty –Name DashboardName –Value $d.DashboardName
 $datum | Add-Member –MemberType NoteProperty –Name DatasetName –Value $d.DatasetName
 $datum | Add-Member –MemberType NoteProperty –Name ReportName –Value $d.ReportName
 $datum | Add-Member –MemberType NoteProperty –Name WorkspaceId –Value $d.WorkspaceId
 $datum | Add-Member –MemberType NoteProperty –Name ObjectId –Value $d.ObjectId
 $datum | Add-Member –MemberType NoteProperty –Name DashboardId –Value $d.DashboardId
 $datum | Add-Member –MemberType NoteProperty –Name DatasetId –Value $d.DatasetId
 $datum | Add-Member –MemberType NoteProperty –Name ReportId –Value $d.ReportId
 $datum | Add-Member –MemberType NoteProperty –Name OrgAppPermission –Value $d.OrgAppPermission

#option to include the below JSON column however for large amounts of data it may be difficult for PBI to parse
 #$datum | Add-Member –MemberType NoteProperty –Name Datasets –Value (ConvertTo-Json $d.Datasets)

#below is a poorly constructed PowerShell statemnt to grab one of the entries and place in the DatasetName if any exist
 foreach ($dataset in $d.datasets) {
 $datum.DatasetName = $dataset.DatasetName
 $datum.DatasetId = $dataset.DatasetId
 }
 $data+=$datum
}

$datestring = $startDate.ToString("yyyyMMdd")
$fileName = ("c:\PBIAuditLogs\" + $datestring + ".csv")
Write-Host (" writing to file {0}" -f $fileName)
$data | Export-csv $fileName

Remove-PSSession -Id $Session.Id
  • Notice that you need to enter O365 audit log privileged credentials at the top so that this can be ran automatically. If you have more clever ways to pass these credentials in so they are not exposed in the file by all means, do that
  • The Do/Until loop handles if there are more than 5000 records in the result set which would easily be the case for a large Power BI community.
  • The foreach loop extracts the AuditData column JSON format and creates an individual record for each entry. This makes the Query Editor in Power BI less complex and easier to accomplish retrieving several hundred thousand records without import errors
  • finally we create a CSV for the data with the date of the file entries (yesterdays info if this is ran at midnight every day). This dumps each file in c:\PBIAuditLogs. You can obviously change this file location to wherever you want to store your CSV extracts

You can use Task Scheduler to run the above PowerShell script every night at midnight.

The PBIX file

In the Power BI file, we are connecting to the content of the entire folder shown above. I went ahead and included the PBIX file WITH the sample data so you could get an idea of what your data may look like.

This is where i have to admit that i tried to use a parameter for this but ran into some Query Editor challenges with how Power BI creates a Sample File transform to import multiple files from a single folder. If you can see what i did wrong here I would love your feedback, but for now, you can ignore the file directory parameter in the Query Editor and need to go to “Advanced Editor” on the “AuditLog” query and modify the file location to be the location you are dumping files from the PowerShell script.

Change the below file location as needed.

Once you have made this change, you should be able to “Close and Apply” and your data will now be populated in this basic audit log analytics view.

Using the file

I created a couple basic pages to get this blog post shipped and so you can start taking advantage of the solution, but it is nowhere near as complete as you can eventually make it. I have a simple overview page that was screenshotted above. It can help you determine number of active users, reports, dashboards, and datasets being used for any time period your audit log data covers.

The second page is a user activity view I created from a calculated table. It helps you determine which users in the system may be inactive so you can re-assign power bi licenses and also shows detailed activity for an individual user that you can select from the slicer.

Other things you can mine from this data:

  • Who has signed up for Free Power BI trials
  • What “Apps” are being created
  • what embed tokens are being generated and used
  • many other possibilities

The PowerShell script and the PBIX file are located on my GitHub here

Link to the original post:  http://angryanalyticsblog.azurewebsites.net/index.php/2018/02/16/power-bi-audit-log-analytics-solution/

Thanks again, Steve

Power BI Is Finally in the Azure Trust Center

With the most recent announcement of Power BI’s inclusion in the Azure Trust Center, it is a good time to review where we are today with Power BI security and compliance as it relates to various customer needs. I do a lot of work with financial, energy, and medical customers. These groups represent a large amount of compliance and regulation needs. I wanted to understand where we are today and this announcement is significant.

What’s in the Announcement?

One the primary roadblocks to accepting the Power BI service has been the lack of compliance and concerns around security. Microsoft has been making a number of enterprise level improvement to the Power BI service and desktop. Power BI now has the following compliance certifications:

PowerBI Compliance 2016

This announcement shows Microsoft’s continued commitment to security and compliance in its cloud based products. While Power BI is not yet to the level of Office 365, some key compliance areas are now covered.

I think the most significant compliance certification is HIPAA/HITECH which removes barriers related for the medical industry. As hospitals, insurance companies, and providers scramble to meet reporting demands from their customers and the government, Power BI gives them a flexible reporting and visualization platform to meet those needs. It will empower self-service in the organizations and departmental or enterprise collaboration with data. The HIPAA/HITECH certification will allow them to use the platform with more confidence and security.

Beyond medical, more institutions will be able to rely on Power BI in a manner that is compliant and safe. As Microsoft continues this journey with Power BI and its other Azure based offerings, customers will be able to react more quickly to the changing business and regulatory environments with confidence in the security and management of their data.

The Reality – You Are as Secure as You Choose to Be

Even with this significant move by Microsoft, you are still responsible for implementing a secure, compliant solution. Microsoft is merely providing tools that are secure and will comply with regulations if implemented correctly. The key to a secure environment will always be you. The data you use and analyze with Power BI is ultimately your responsibility.

I encourage you to review the following resources in addition to the ones above as you determine your security and compliance within the Power BI product:


Excel BI Tip #26: Using a Data Spreadsheet or Tab

As I mentioned in my original post, Exploring Excel 2013 as Microsoft’s BI Client, I will be posting tips regularly about using Excel 2013 and later.  Much of the content will be a result of my daily interactions with business users and other BI devs.  In order to not forget what I learn or discover, I write it down … here.  I hope you too will discover something new you can use.  Enjoy!

Data Sheet or Tab in Excel

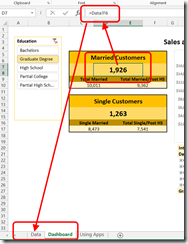
With a lot of the dashboard designs in Excel I work on, we often use CUBE formulas and other calculations and functions to get the data ready for the presentation area. One of the key things we do is create a sheet in the workbook, or tab, that will allow you to hold this data. This allows us to refer to cells on the data tab in our visualizations without trying to support visualization techniques along with calculations.

The most common scenario is when I want to present numbers in the visualization that are not in a pivot chart or pivot table. By keeping this in the data tab I have maximum flexibility in the visualization.

Let’s look at the following example using Adventure Works data (from http://msftdbprodsamples.codeplex.com/). We will create the following “data box” visualization using a data tab.

image

First, get the data into data sheet using a pivot table. Once we have the data we want to present there, we flatten the pivot table (see Excel BI Tip #18 for details). Now we can refer to the fields we need using the data tab. In the following images you can see the data box referring to data on the data tab which uses the CUBE functions to get the data.

image  image

As you can see, this allows us to contain a lot of data that is used for processing without cluttering up the visualization.

Hiding the Data Sheet from Users

Using a data sheet also means we need to hide this sheet from our users. You can hide the sheet in Excel directly. This is most useful when the workbook will be shared as a workbook. However, if you deploy the workbook to SharePoint or Office 365, you can use the Internet Settings to only make ranges or sheets visible depending on your implementation. I prefer this process as it allows dashboard designers to easily access the data without needing to be concerned with hiding the data sheet once they are done. (Refer to Excel BI Tip #21 for more about using ranges.)

When used in SharePoint or Office 365, their is no impact to the visualizations which use the data sheet. While not visible or available to the user, the data sheet stills supports the visualization as expected. In scenarios I have delivered, this technique has allowed for extensive data manipulation and formatting to present data in meaningful ways.

Excel Tip #22: Combo Charts – Out of the Box Functionality

As I mentioned in my original post, Exploring Excel 2013 as Microsoft’s BI Client, I will be posting tips regularly about using Excel 2013 and later.  Much of the content will be a result of my daily interactions with business users and other BI devs.  In order to not forget what I learn or discover, I write it down … here.  I hope you too will discover something new you can use.  Enjoy!

Creating a Combo Chart

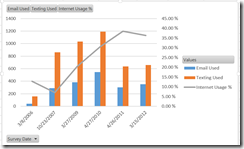
Excel supports a couple of options for overlaying lines on bars or columns. The most common method is to use the combo chart. In this option, you would put metrics into the chart and then select which is the bar and which is the line. This is particularly helpful when using different types of metrics such as counts and percentages. To set this up, you create the initial chart with the metrics you want and then change the type. In the example below I have text and email usage counts with internet usage as a percentage in a column chart.

image

Select the Change Chart Type option on the PIVOTCHART TOOLS menu.

image

In the dialog that is opened, choose Combo Chart at the bottom. Excel will separate the values into lines and columns. In my case, it picked correctly, but be sure to check as it does not do what you want all the time. Because I am using percentages and counts, I want to have a secondary axis. My result is below. We can now look at percentages and counts in the same chart.

image

This functionality can only be used with column charts and lines or areas. The value is being able to show two types of data on the same chart. Up next, we will look at overlaying charts in Excel which gives you more design options for your dashboard.

Excel Tip #21: Hiding Scrollbars in Excel Services Web Part

As I mentioned in my original post, Exploring Excel 2013 as Microsoft’s BI Client, I will be posting tips regularly about using Excel 2013 and later.  Much of the content will be a result of my daily interactions with business users and other BI devs.  In order to not forget what I learn or discover, I write it down … here.  I hope you too will discover something new you can use.  Enjoy!
The Issue – Scrollbars in Excel Services Web Part

In SharePoint and Office365, we have the ability to add Excel dashboards we have created to our BI site. This is easily done by editing your dashboard page and adding the Excel Services web part. Here is the example I use based on the MyVote application analytics. When deployed as an entire workbook, you will see the tabs at the bottom and the vertical and horizontal scrollbars.

image

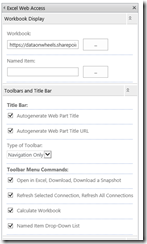
The first place to look to solve this issue is in the web part properties.

image

In the first group of settings, we can hide the toolbar. In our view there is no recognizable or relevant changes. We had navigation only turned on, but have now changed it to None. We will skip the Navigation options and check out the next two sections – Appearance and Layout.

image

Here we can adjust the size in appearance. We made this change, but the scroll bars did not go away.

So what do we do now?

Using Named Ranges

After doing a lot of searching online, I came across this option. By using Named Ranges in Excel we can hide scrollbars. While other options were sometimes brought up, the named range option has worked as expected.

Creating a Named Range

Our first step is to create a named range. Highlight the cells you want to include in your web part. In my case, I am highlighting the A1 through M39 range. Once you have the area selected, choose the FORMULAS tab and click Define Name. You can also create ranges using the Name Manager. The name manager is most helpful when modifying or removing existing ranges.

image

In the New Name dialog, specify a name. In my case I use Dashboard if only one Excel range will be used. If you plan to create more ranges for implementation throughout SharePoint, the key is remembering what you named the range. In the web part property settings, there is no look up for the ranges. You will need to get the spelling correct in order for it to be used.

image

Making the Named Range Visible

In order to make named ranges available in Excel Services, you need to change your Browser View Options. You can find the Browser View Options on the FILE menu in Excel. When you open the FILE menu, you will see Browser View Options at the bottom. This option controls how Excel operates in Excel Services on SharePoint and Office 365.

image

In the dialog you will see two tabs – Show and Parameters. For this post we are only concerned with Show. I will expand on this fully in a later blog. In our scenario, we need to change from Entire Workbook to Items in the Workbook. Then we can select the named range we created in Excel. Once you have done this, the only part of the workbook that will be visible in a web part is the named range. You will get an error unless you specify the range.

image

Once you make the change, save the workbook back to Excel.

Updating the Web Part to Use the Named Range

The next step is to update the web part to use the named range. Go back to the page we are working in and edit the web part. (Be aware if you only have one named range exposed to Excel Services, it will update the site accordingly.) In the Named Item area add the name of your named range and it will be what is shown in this web part.

image

Resetting the Size to Eliminate Remaining Scrollbars

The final step is to go into the Appearance section and updating the Height and Width settings until the scrollbars are gone.

Limitations Using Named Ranges

While this does solve a very annoying visual issue and user experience is improved, we do lose some functionality. For example, if you happen to use links in your worksheets to link to other worksheets within the workbook, these no longer work. Also, if you want to use multiple sheets on your dashboard or portal, you will need to add additional web parts or pages to support other named regions. Overall, the user experience trumps these limitations and lead to a really nice dashboard.

Here is the cleaned up dashboard view:

image